Sinking more putts comes down to knowing exactly where your ball is going to break. While reading greens with your feet and eyes is a true art, having a tool that gives you a look under the hood can transform your confidence on the putting surface. This guide will walk you through exactly how to read GolfLogix green maps, helping you eliminate the guesswork on break and speed so you can focus on making a confident stroke.
What Exactly is a GolfLogix Green Heat Map?
Think of GolfLogix green maps as a powerfully simple topographic chart for every green you play. Instead of confusing lines and numbers, it uses a color-coded "heat map" to show you the severity and direction of the slope at a glance. It’s a lot like looking at a weather radar - once you know what the colors mean, you can instantly understand the forecast for your putt.
The core components are straightforward:
- Colors: These show you the steepness or severity of a slope. The color spectrum ranges from cool blues and greens (flatter) to hot oranges and reds (steeper).
- Arrows: These show you the direction of fall. Just like water would flow down a hill, these small white arrows point in the direction the ground is sloped.
By combining these two visual elements, you get a complete picture of how your ball will roll from any point on the green to the hole.
Breaking Down the Visual Elements: Colors and Arrows
To master the heat map, you first need to become fluent in its language. Let’s break down what each color and array of arrows are telling you.
Decoding the Colors: From Blue to Red
The heat map’s colors give you a quick, intuitive read on the steepness of any part of the green. This information is your primary guide for figuring out putt speed.
- Blue & Green: These represent the flattest sections of the green. When your putt travels mostly over blue or green areas, you can expect very little break and will need to provide most of the pace yourself. These are areas with less than a 1% slope.
- Yellow & Orange: Here, the slopes are getting more noticeable. A putt across these sections will have a clear and defined break. On downhill putts through these zones, you’ll barely need to breathe on the ball. Uphill putts will require a firm, solid stroke. These colors typically indicate slopes from 1-3%.
- Red: Welcome to the danger zone. Red signifies the steepest parts of the green (generally over 3% slope). Putts on red areas will break significantly. Downhill putts on red slopes are incredibly fast and need a delicate touch, while uphill putts feel like you're putting up a wall. Avoid leaving your approach shots in red areas if you can help it!
Following the Arrows: The Directional Guide
While the colors tell you how much a putt will break, the small, crawling arrows tell you which way. Simply put, the arrows point in the direction the green is sloping - the "fall line."
- Direction: If your putt is rolling across arrows pointing to the right, your putt will break to the right. If they're pointing left, it will break left. If they point directly at the hole, you've got a straight uphill putt. If they point directly away, you have a straight downhill putt.
- Density: The arrows do more than just point. The closer together they are, the more severe the slope. A jumble of tightly packed arrows in a red zone confirms a steep, fast part of the green. In blue areas, you might only see a few arrows spaced far apart, telling you the slope is quite gentle.
By blending your understanding of colors and arrows, you already have a massive advantage. If your line crosses a big red patch with arrows pointing sharply to the right, you know you're facing a fast, big-breaking right-to-left putt.
Putting It All Together: A Four-Step Guide to Reading Any Putt
Knowing what the map shows is one thing, using it practically on the course is another. Here’s a simple, repeatable routine to read a putt using GolfLogix.
Step 1: Get Your Position and Perspective
As you approach your ball, stand behind it and open the GolfLogix app. Use the map to get your bearings. You can use the "Drop Ball" feature to place your location on the map with great precision, orienting the app with landmarks around the green. Now you have a bird's-eye view with your starting point and the cup clearly marked.
Step 2: Identify Your Ball-to-Hole Line
Now, visualize a straight line from your ball to the hole on the map. Pay close attention to the colors and arrows spread across this line. Is the entire path one color, or does it transition? For example, your putt might start in a yellow area, cross over a flat blue section, and finish in an orange zone near the hole. Each of these zones will affect your ball's speed and direction.
Step 3: Read the Putt to Determine Break and Speed
This is where you combine the observations from the previous step. Let's look at a few common scenarios:
- Example #1 (A Gentle Swinger): Your ball is in a yellow zone 15 feet from the hole. The arrows along your path are consistently pointing to the left of the hole. This tells you it's a left-to-right breaking putt with a moderate amount of slope. You'll need to aim a bit outside the left edge and give it a decent pace.
- Example #2 (A Sneaky Double-Breaker): Your putt has to "go over" a ridge. The map might show the line starting in a red zone with arrows pointing right, but then it transitions to a green zone where the arrows point left just before the hole. The map is visually showing you it will break one way first and then the other. Without the GolfLogix map, this is a very tough putt to see with your eyes alone.
Don’t forget to check the area directly around the hole! Many three-putts happen because golfers forget to account for how the ball will behave in the final two feet. A big red zone right by the cup means the ball is going to dive hard at the last second.
Step 4: Cross-Verify with Your Feel and Eyes
The heat map is an incredible guide, but it's not a substitute for your natural athletic instincts. After you’ve looked at the app, walk around the putt. Look at it from behind the hole. Does what you see with your eyes and feel with your feet match what the map said? In most cases, it will align perfectly and give you immense confidence.
Use the map to give you the foundational read - the objective truth of the slope. Then use your eyes to confirm it and feel for the speed. This combination is what turns guesswork into confident decision-making.
Advanced Tips and Common Issues
Once you're comfortable with the basics, here are a few more ways to use the green maps to your advantage.
Looking Beyond Your Putt
Don't just think of the heat map as a putting tool. It's a strategic weapon for your whole approach game. Before you even hit your approach shot, take a quick look at the green map. Where are the difficult red zones? Where are the flat, welcoming blue and green areas? By identifying the "safe zones" before you swing, you can aim for the largest, flattest portion of the green to give yourself the easiest possible putt - even if it's not right next to the pin.
Avoiding Over-Analysis
It can be tempting to stare at the map, trying to analyze every tiny color patch. Remember that golf is still a game of feel. The goal is to get a quick, accurate read, internalize it, and then commit to your stroke. Use the map to get a clear picture of speed and line, trust it, and hit your putt. Don’t let yourself get bogged down by "paralysis by analysis."
Navigating Multi-Tier Greens
Huge, sweeping greens with multiple tiers are where a heat map truly shines. It can be hard for your eyes to pick up the full extent of a large swale or sharp ridge. The GolfLogix map makes it simple. It clearly shows the "cliff" of the tier in dark red. If your putt needs to go up or down a tier, the map helps you understand exactly how much extra pace you'll need (going up) or how cautious you need to be (going down).
Final Thoughts
Learning to read GolfLogix green maps takes the ambiguity out of putting. The colors show you the severity of the slope, guiding your sense of speed, while the arrows provide a clear path for the break. This blend of information removes what can be a confusing part of the game and lets you putt with more conviction.
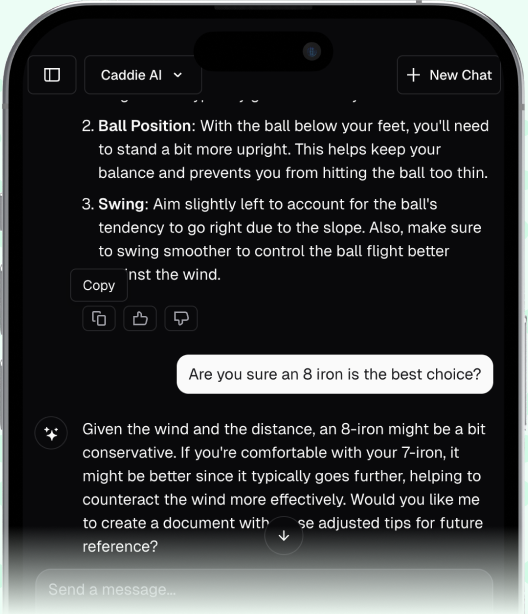
That feeling of confidence from having a clear plan isn't limited to just the putting surface, it can extend to every single shot you face. At Caddie AI, we built our app on this same principle of making the game feel simpler. Whether you're deciding between clubs on a tricky par-3, needing a smart strategy off the tee, or facing a tough recovery shot, we want to give you that expert second opinion. It's about taking the guesswork out of golf, so you can commit to every swing with clarity and confidence - not just your putts.