Looking at a golf green heat map for the first time can feel like trying to make sense of a modern art painting - lots of colors and strange lines, but what does it all mean for your putt? This guide will break down exactly how to interpret these powerful tools, step by step. We’ll cover how to decode the colors and arrows so you can use these maps to read greens with confidence and sink more putts.
What Exactly Is a Golf Green Heat Map?
Think of a heat map as a topographic map specifically for the subtle, and sometimes not-so-subtle, contours of a golf green. While your eyes might be tricked by optical illusions or the specific cut of the grass, a heat map uses precise data to show you exactly how the green is sloped. It removes the guesswork and gives you a clear visual guide to a green’s contours.
Most heat maps use two main features to communicate this information:
- A color spectrum to show the steepness or severity of the slope.
- Small arrows or chevrons to show the exact direction of the slope (the break).
When you learn how to read these two elements together, you gain an incredible advantage. You’re no longer just guessing how a putt will break, you're making an informed decision based on data about what it will do.
Decoding the Colors: Understanding Slope Severity
The first step in understanding a heat map is getting to grips with what the different colors mean. While the specific palette can vary slightly between different apps or books, the principle is almost always the same. It works like a weather radar map: cool colors mean mild activity, and hot colors mean intense activity.
Here’s a common breakdown:
- Blue and Green: These are the “cool” colors, indicating areas that are very flat or have minimal slope (less than 1% grade). When your putting line runs through a blue or green zone, you can expect very little break. These are the straightest putts on the green.
- Yellow: This color signifies a moderate slope, usually in the 1-2% grade range. Putts in a yellow zone will have a noticeable but manageable break. This is where most of the break on an average green occurs.
- Orange and Red: These are the “hot” zones. They represent the steepest sections of the green, often with a slope greater than 2% or 3%. A putt rolling through an orange or red area will break significantly. Speed control is tremendously important here, as the ball will react much more to the severe slope.
Imagine your ball is sitting in a yellow zone, and the path to the hole goes through a big patch of red. This tells you that an initial moderate break is about to become much more severe as the ball gets closer to the hole. This kind of information is almost impossible to pick up with just your eyes, but the heat map makes it beautifully clear.
Following the Arrows: The Direction of the Break
Once you understand how severe the slope is from the colors, you need to know which way it’s going. That’s where the arrows, often called "fall-line indicators," come into play. These little arrows are perhaps the most valuable part of the map.
The concept is simple: The arrows point in the direction that gravity will pull the golf ball.
Think of it this way: if you were to pour a bucket of water on the green, which way would the water run? The arrows show you that path. They represent the "fall line," or the most direct downhill path at any given point on the green.
Putts will always break in the direction the arrows are pointing. If the arrows along your putting line point to the right, your putt will break to the right. If they point to the left, it’s a left-breaker. If the arrows point directly away from you towards the hole, you have a dead-straight downhill putt. If they point from the hole back at your ball, it's a straight uphill putt.
A Step-by-Step Guide to Using a Heat Map for Your Putt
So, you’re standing over your ball with your heat map in hand. How do you combine the colors and arrows into a real, functional read? Let’s walk through a practical, step-by-step process.
Step 1: Locate Your Ball and the Hole
The first thing to do is find the exact position of your ball and the hole on the digital map. Get a clear mental image of the line connecting the two points.
Step 2: Scan the Colors Along Your Line
Now, look at the colors along that entire putting line. Are you crossing from a yellow zone into a red zone? Is the whole putt mostly in a calm blue area? This will give you your first major clue about the amount of break to expect. A line that crosses through a lot of orange and red is going to require you to aim much further outside the hole than a line that stays in the yellow and blue.
Step 3: Analyze the Arrows on a Right or Left Breaking Putt
Next, focus on the little white arrows. Look at how they are oriented in relation to your putting line. For example, if your line is traveling from 6 o’clock to 12 o’clock, and all the arrows along the way are pointing to 3 o’clock, you have a pure right-to-left breaking putt.
More often, you'll have a combination putt. Perhaps the arrows at the start of your putt are pointing slightly to the right, but as they get closer to the hole, they start pointing more aggressively to the right. This tells you it’s a right-breaker that will start breaking more sharply in the second half of the roll.
Step 4: Putting it Together to Pick Your Aim Point
This is where you combine the "how much" (colors) with the "which way" (arrows).
Let’s say you have a 20-foot putt. The heat map shows the first 10 feet are in a yellow area with arrows pointing slightly right, and the last 10 feet are in a red area with arrows pointing hard right. This means you have a putt that’s going to start with a gentle rightward break and then take a much bigger turn toward the hole. Knowing this, you’ll aim further left than if the entire putt was just yellow.
Applying the Knowledge: Uphill vs. Downhill Putts
Heat maps are also excellent for judging pace, especially on those treacherous uphill and downhill putts where speed is everything.
Reading Downhill Putts
You can identify a downhill putt when the arrows along your path are pointing in the same direction you want your ball to travel - away from you and towards the cup. The color will then tell you just how downhill it is.
- A yellow or light orange downhill putt: It’s quick, but manageable. You need a gentle stroke.
- A dark red downhill putt: Danger! This putt is extremely fast. You might feel like you just have to breathe on the ball to get it rolling. You definitely don’t want to be above the hole in a red zone.
Reading Uphill Putts
You’ll know you have an uphill putt when the arrows along your line are pointing back at you, away from the hole. The ball is fighting gravity the entire way.
- A yellow or light orange uphill putt: It's going to be slow. You can afford to give this putt a solid, firm rap to ensure it gets to the hole.
- A dark red uphill putt: This is a real workout for your putter. These putts require a very aggressive stroke. People often leave these drastically short because they have a hard time believing how hard they need to hit it. The red color gives you permission to be bold.
A Final Word of Caution: Don’t Just Trust the Map
While an incredibly powerful tool, a heat map should be used to support - not replace - your own green-reading instincts. It’s an essential source of information, but it doesn't know the exact green speed for the day, or if there's a small, unrepaired ball mark right on your line. Always use the map to get your primary read, but then take a final look with your own eyes from behind the ball. Combine the data from the map with the feel from your feet and the visual you get in the real world. That combination of technology and golfer’s instinct is what leads to truly great putting.
Final Thoughts
Reading a golf green heat map successfully comes down to understanding two simple elements: color for slope severity and arrows for slope direction. By combining an analysis of how steep the putt is with exactly which way it's breaking, you can eliminate much of the uncertainty from your putting and start rolling the ball with genuine confidence.
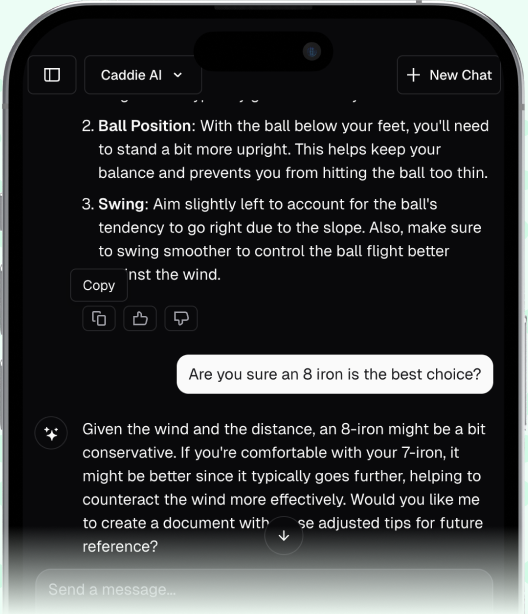
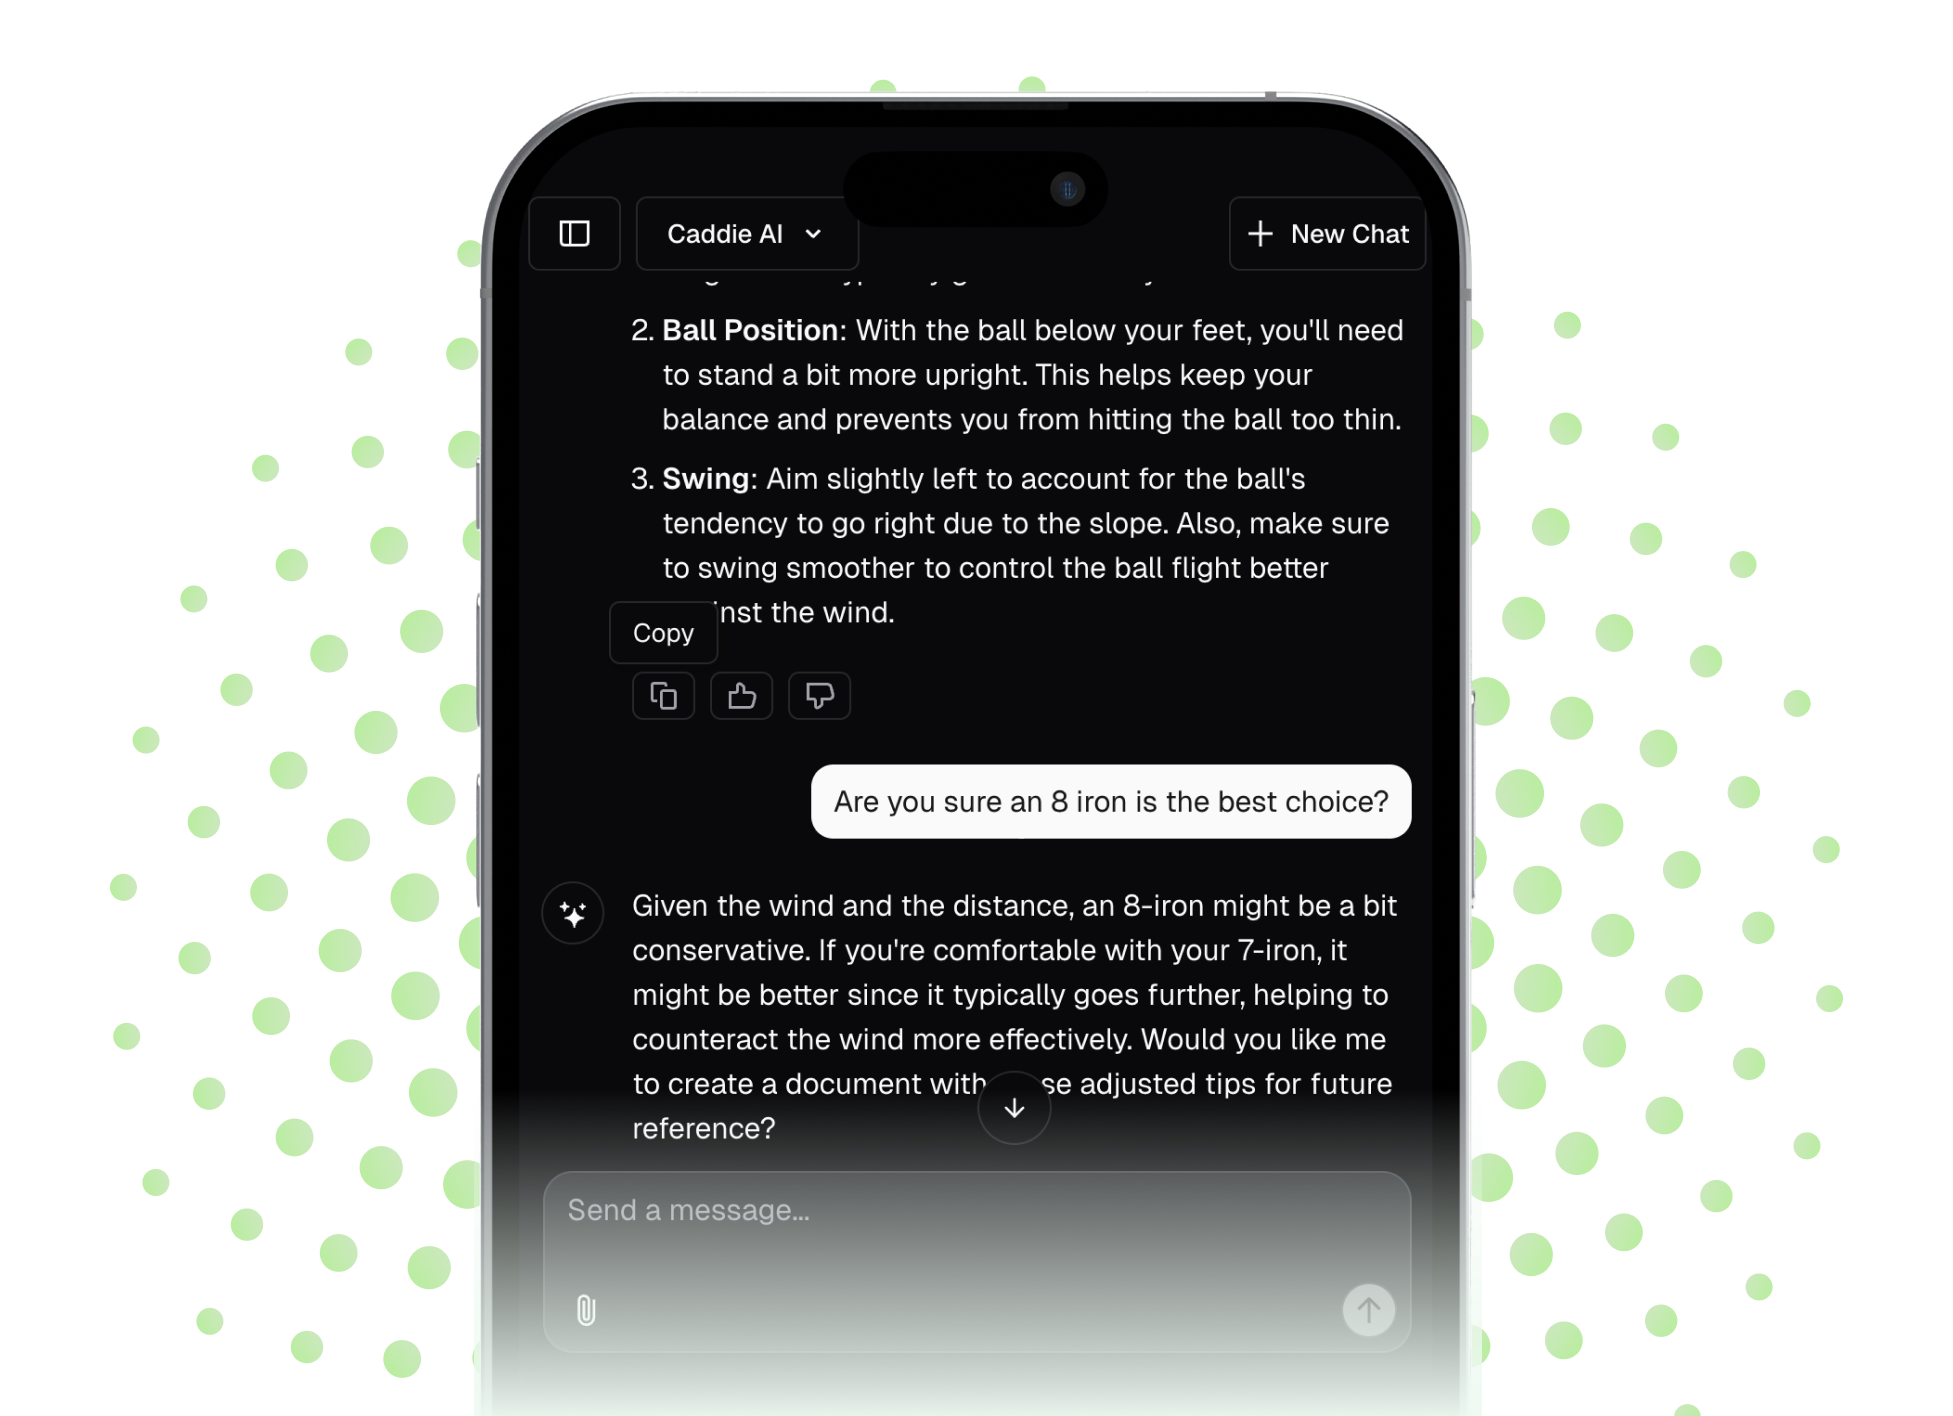
Once you’ve started mastering the greens, the next step is applying that same level of strategic thinking to the rest of your game, from tee to green. That’s why we built Caddie AI. We give you on-demand, expert-level advice for any situation on the course - from choosing the right club on a tricky par-3 to figuring out the smartest way to recover from the trees - so you can play with the same confidence you have on the putting green, for every single shot of your round.